
The Bigger Picture on US Treasuries Pt1 - The Setup
On 10th November last year I wrote a post entitled Strange Days on US Treasuries. In that post I was looking at a very important inflection point that looked likely to be coming up on US Treasuries over the next few months to a year. I would suggest you read that post for the detailed analysis there of the outlook for US debt levels and interest payments as I’ll be looking at those in less detail this week.
This is a series of four posts reviewing the US Dollar, US Treasuries, and why the US Dollar may lose its status as the world’s main reserve currency. I published the first post in this series looking at the US Dollar on Monday 14th April last week and you can see that here.
After writing a lot of this review on bonds it became clear that I can’t fit it into one post so I am dividing it into two. This post will look at historical bull and bear markets on bonds, the setup for a major increase in bond yields over coming months and years, and why that might play out rapidly rather than slowly.
The second post on bonds, entitled ‘The Bigger Picture on US Treasuries Pt2 - Absent Friends’ will look at the reasons why we might well see a serious crisis in US Treasuries this year to deliver that increase, and how that crisis may already have started in the spike on bond yields we saw shortly after ‘liberation day’.
I was saying in videos last year after Trump won the election that I thought the odds of a crisis on US treasuries this year were high based on my expectations of Trump’s policies on tax cuts and tariffs particularly and since then in my view the odds of that have risen considerably. Let’s have a look at the setup for that.
The first thing to say here is that bonds move in long secular bull and bear markets that last decades, and that these markets on bond prices and bond yields are inverted, so as bond prices go up, bond yields go down. Since 1900 there have been just four completed bull and bear markets (based on 10 year treasury yields) and these have gone as follows:
Jan 1900 - Jun 1920 - bear market- Yields rose from 3.7% to 6.4%
Jul 1920 - Aug 1946 bull market - Yields fell from 6.4% to 2.5%
Sep 1946 - Sep 1981 bear market - Yields rose from 2.5% to 15.8%
Oct 1981 - Mar 2020 bull market - Yields fell from 15.8% to 0.4%
Apr 2020 - (2040-50?) bear market - Yields rise from 0.4% to (5% high so far)
In 1900 of course the US dollar was on the gold standard, having adopted that in 1879, and US dollars were fully convertible into gold until 1933, and then partially convertible into gold until that peg was entirely severed by Nixon in 1971. The end of the gold standard expanded the interest rate range for bonds considerably on both the upside and downside.
What are the takeaways from this past secular bull and bear markets on bonds? The first is that the current bear market on bonds will likely last until at least 2040 and probably end before 2050, so the current bear market is likely just getting started. The data is limited by the length and therefore limited number of these cycles but the yield high on this current bear market could exceed the Sep 1981 high at 15.8%. I’m just putting this cycle in context as ten year yields have been under 6% since 2000, and under 5% since 2007. It has been a quarter of a century since interest rates were regularly over 5% but between 1967 and 2000 5% was a floor rather than a ceiling for interest rates and it would not be historically surprising if that became the case for the next quarter century as well.
In my 10th November post I was looking at the bullish setup on TNX that was likely setting up a retest of the late 2023 high at 49.97. That bull flag I was looking at broke up but didn’t retest the high, instead expanding into what looked like it might become a larger bear flag, but what now looks like a triangle. Either way the ultimate target would likely be a retest of 49.97.
TNX daily chart:
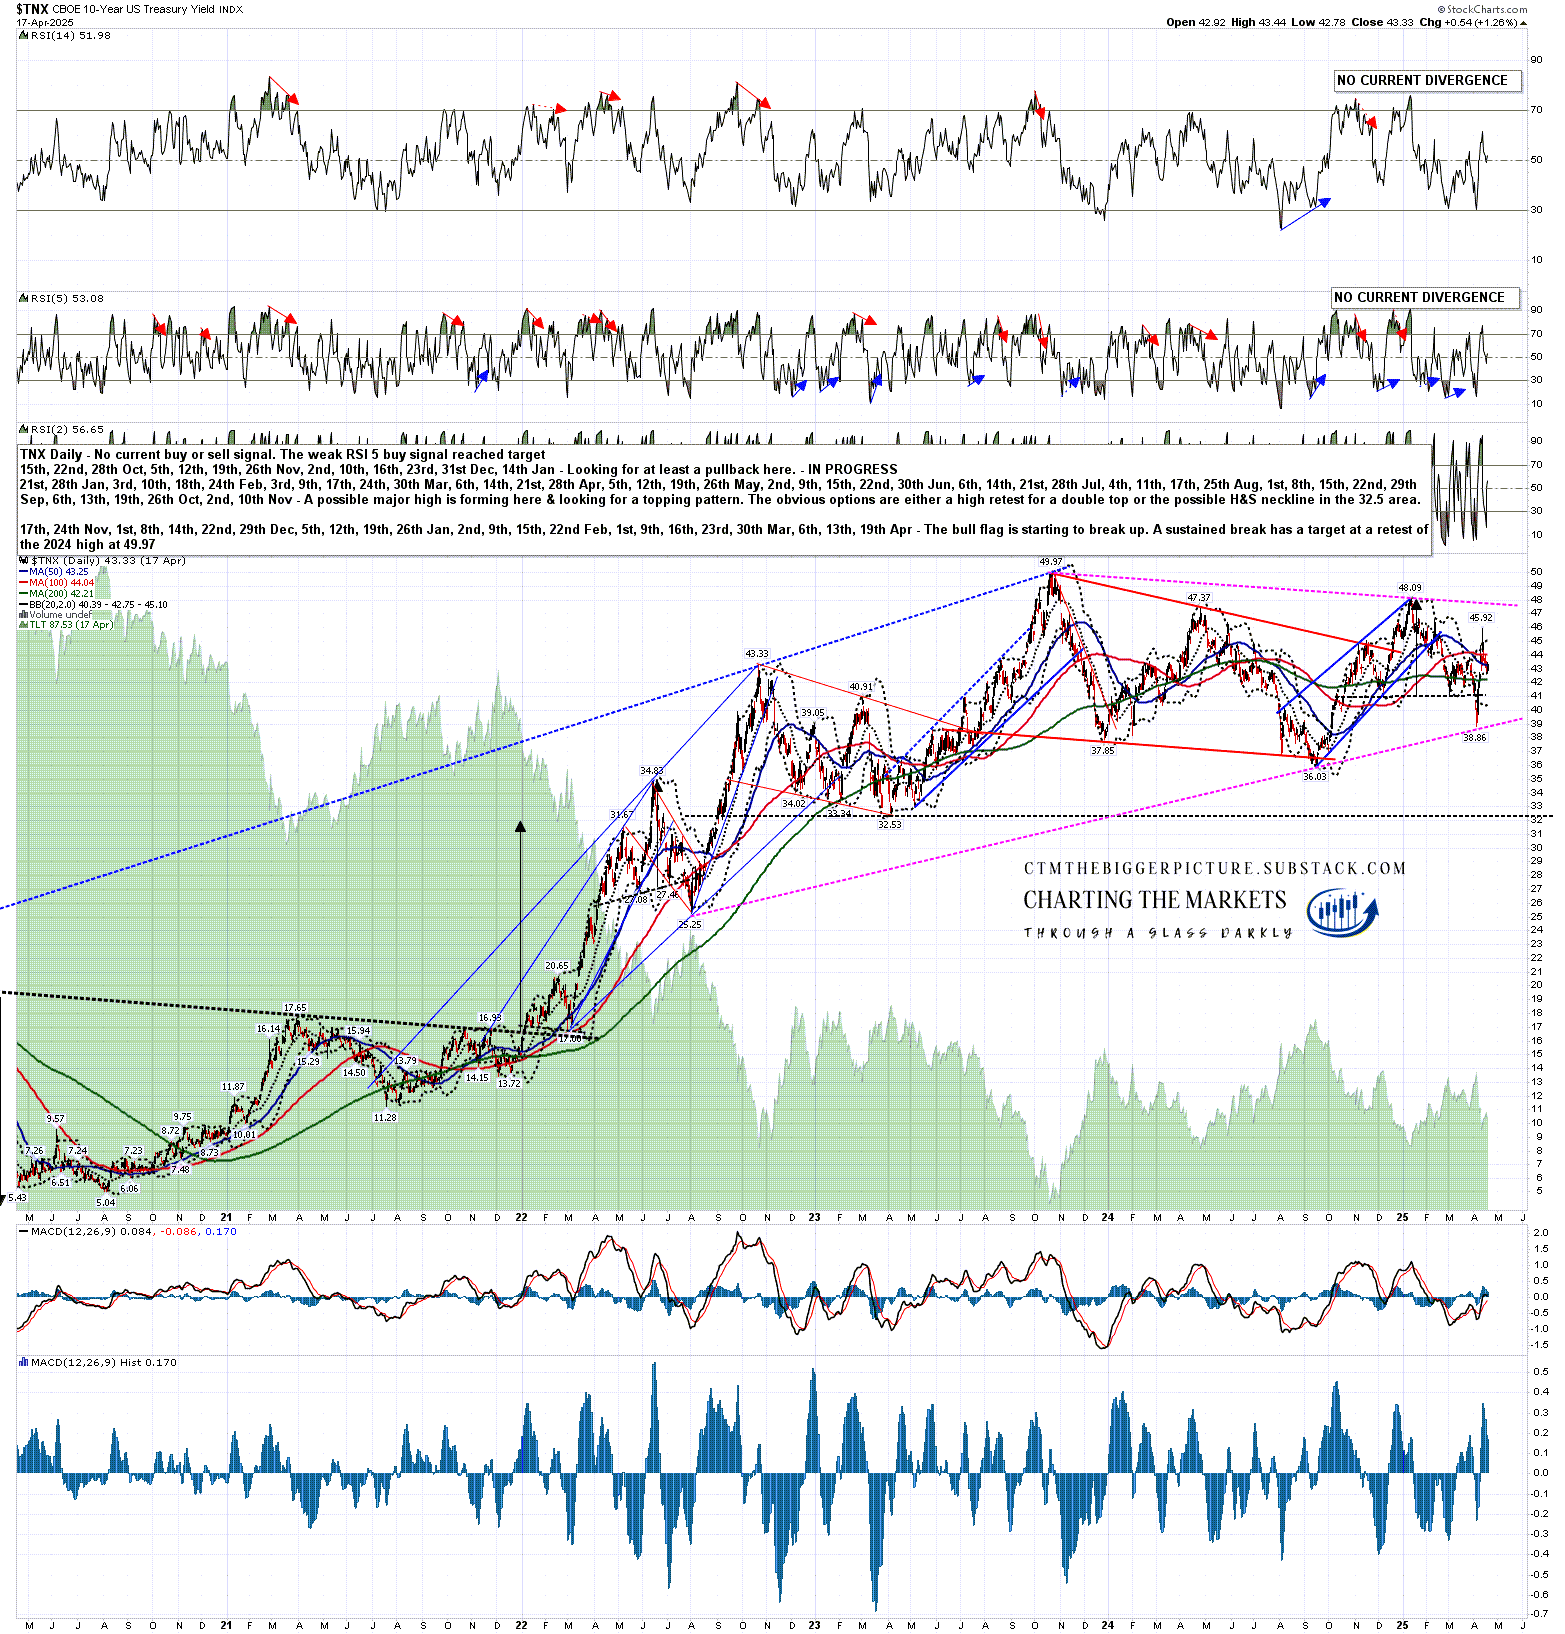
It did look as though TNX would be heading down further first, with an H&S breaking down on the hourly chart looking for a target at a retest of the Sep 2024 low at 36.03, but then in the spike higher on bond yields, just before Trump delayed some of the tariffs, that H&S failed on the strong move over the H&S right shoulder. That invalidated the downside target and triggered a failure target at a retest of the Jan 2025 high at 48.09. Once that target is reached I would expect some follow through to retest the current decade high at 49.97.
TNX 60min chart:

I mentioned in my Strange Days on US Treasuries post that the retest of 49.97 would put TNX into a big inflection point from where it could break down from a large double top with a target in the 15 area, returning to the interest rate lows of the 2011-6 period, or break much higher.
What would a break higher look like? On the TNX monthly chart below you can see that a possible very large IHS has been forming on TNX since 2001, and a retest of 49.97 would complete that IHS and break up from it slightly towards an IHS target in the 96 area. On this chart that would retrace a little under 61.8% of the decline in rates during the 1982-2020 bull market on bonds, a reasonable enough retracement target after a big trend breaks.
TNX monthly chart:

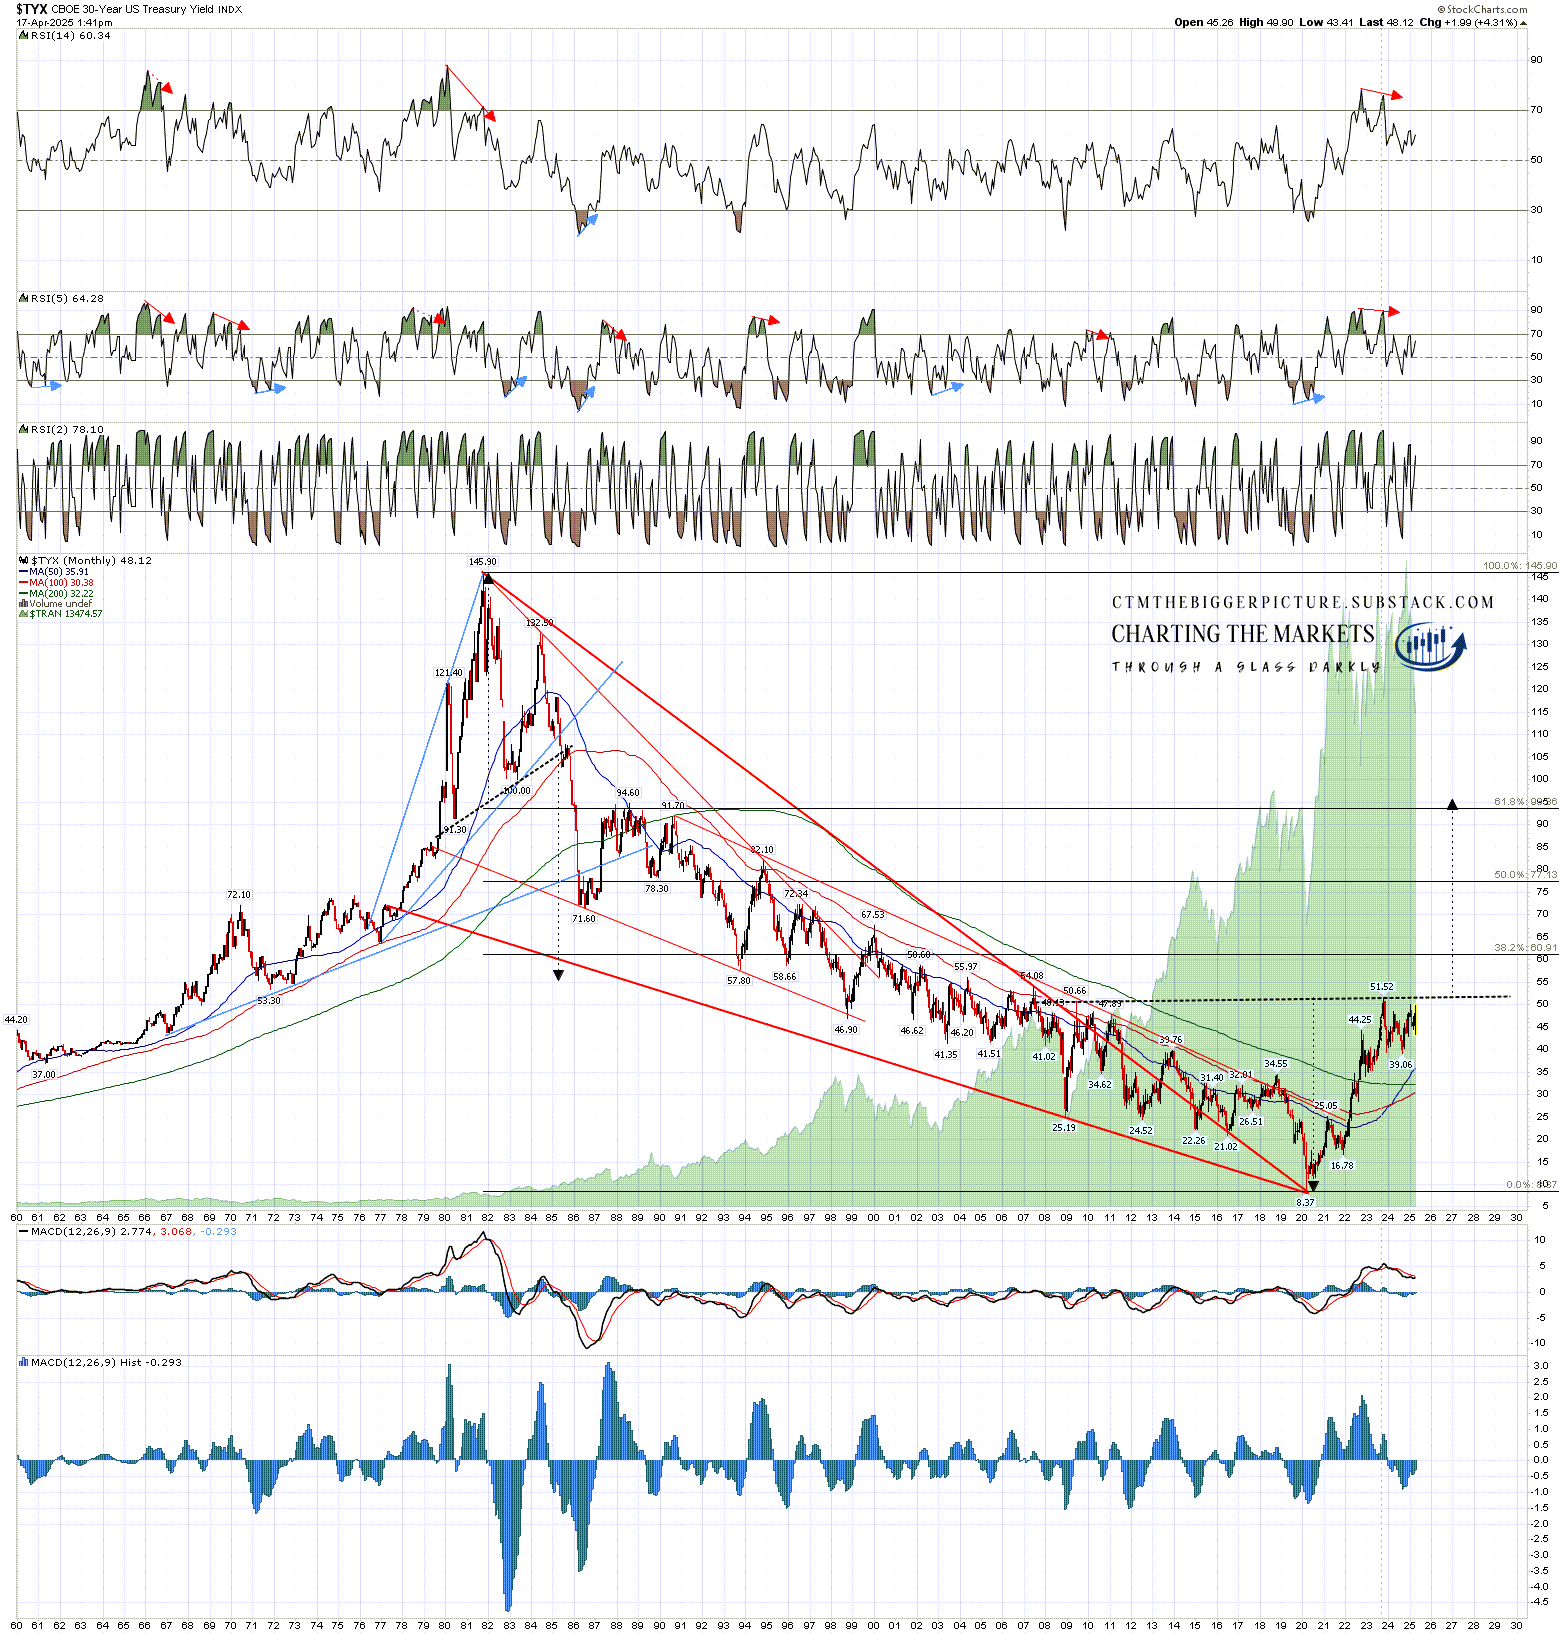
There is another, even nicer possible IHS that has been forming on TYX (30yr treasury rates) since 2006 and a break up from that would also look for a target in the 96 area, in this case retracing slightly over 61.8% of the decline in 30 year yields in that same bull market in bonds.
TYX monthly chart:
What could cause such a huge (by recent historical standards) increase in bond yields in the US in coming months and years? The obvious answer would be a major loss of confidence in US treasuries as a reliable and necessary store of value.
In effect the US has long been treated as a bank, with trading partners parking funds in US debt for long periods for convenience and in the confidence of getting their funds back quickly if desired. Like a bank though, if there is a sudden and general loss of confidence then there may be a rush for the exit, and that initial rush for the exit might snowball into a general selling of US treasuries and assets. Like a bank run too, the early sellers would recover all or most of their money, while later sellers would be selling after there had already most likely have been a sharp decline in both the US Dollar, and the price of those US treasuries.
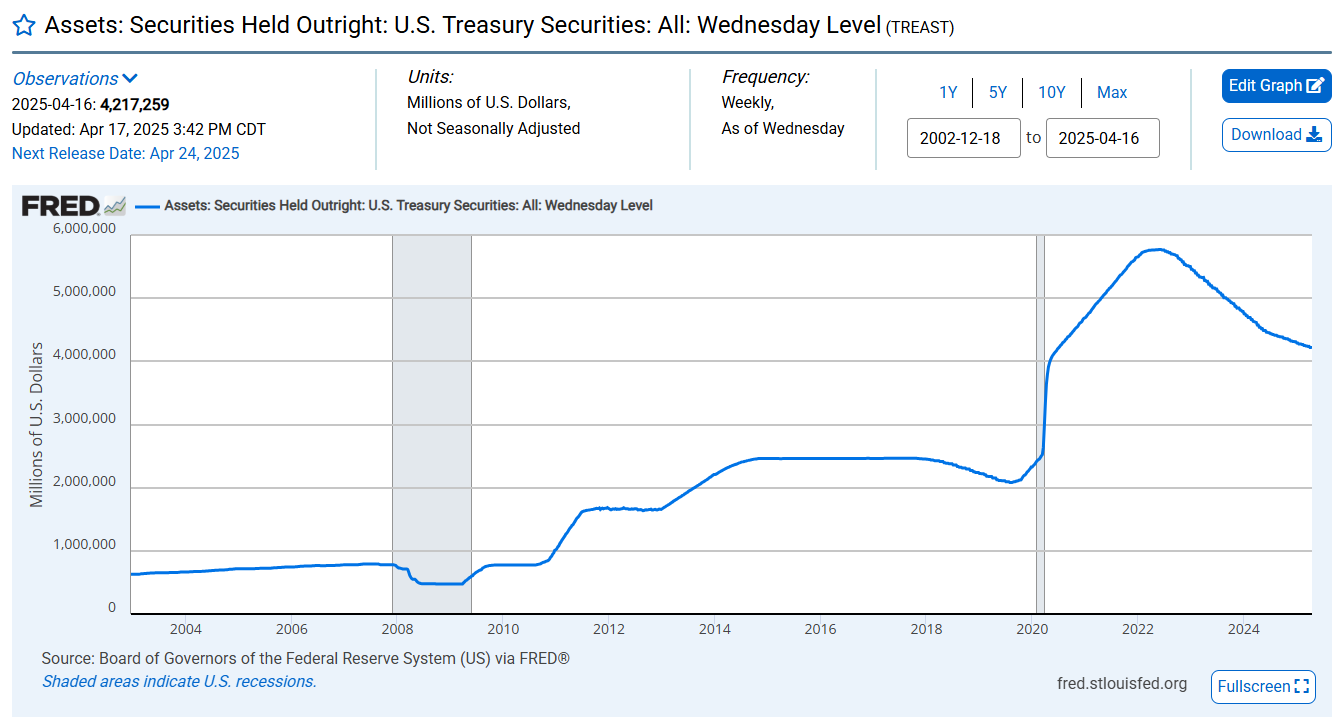
These are the circumstances under which US interest rates could double because, as I noted in November, it is a polite fiction that interest rates are set by central banks, they are really set by bond markets, and if US treasuries were to sell off hard, then there is little that the Fed could do about it, though they could, and likely would, blunt the impact of this by buying up some of the US treasuries being sold. They already hold over $4tn in US treasuries though, and a large further expansion of those holding would be a bold financial experiment that might end very badly.
FRED Federal Reserve Holdings of US Treasuries:
Look out for the next in this series to be published soon. That will be published here and will be entitled The Bigger Picture on Treasuries Pt2 - Absent Friends. I will be examining there in detail why there could be a major loss of confidence in US Treasuries coming this year.
If you like my analysis and would like to see more, please take a free subscription at my thebiggerpicture substack, where I publish these posts first and do bi-weekly videos looking at equity indices, bonds, currencies and commodities. If you’d like to see those I post the links on Wednesday and Sunday evenings on my twitter, and the videos are posted on my Youtube channel.